
EWG mapping tool could assist USDA Mississippi River Critical Conservation Area protection
By Soren Rundquist, Director of Spatial Analysis
EWG has developed a mapping tool to track the effectiveness of U.S. Department of Agriculture programs and identify opportunities for county-level efforts to improve water quality, climate resiliency and flood mitigation in the Mississippi River Critical Conservation Area, or MRCCA – a basin of more than 387 million acres across 13 states ad 2,300 miles of the Mississippi River.
The MRCCA is one of eight U.S. regions covered by USDA’s Regional Conservation Partnership Program, which emerged from the 2014 Farm Bill and seeks to encourage stakeholders in those areas to pursue common natural resource goals while maintaining or improving agricultural productivity.1
The Mississippi River is a source of water, food, industry and recreation for millions of Americans, and its surrounding areas serve as an essential migratory corridor for hundreds of bird species.
In establishing the MRCCA, the USDA hopes to accelerate nutrient- and sediment-loading reduction from 138 million acres of cropland, primarily corn and soybeans, to local and regional bodies of water. Within the MRCCA, water quality degradation, inadequate habitat and insufficient water or drought have been identified as the priority concerns for farmers and other stakeholders to address.2
EWG’s geospatial analysis focuses on applied fertilizer and manure, four sensitive landscape areas currently in crop production, and data on federal investments from USDA programs. The effort yielded county-level statistics that stakeholders could use to explore various intervention scenarios that could help to improve water conservation, flood mitigation and climate resiliency of affected bodies of water.
Cropland treated with fertilizer
According to the 2017 USDA Agricultural Census, 71 percent of all harvested cropland in the MRCCA is treated with fertilizer and another 7.9 percent with manure. At the state level, areas with above average fertilizer application to crops, covering 7.5 million acres, are located in Illinois, Indiana, Iowa, Minnesota, Missouri and South Dakota (Figure 1). These six states account for 74 percent of the fertilized area in the MRCCA. Manure applied to cropland in Arkansas, Iowa, Minnesota and Wisconsin exceeded the region average and accounts for 62 percent of all applications.
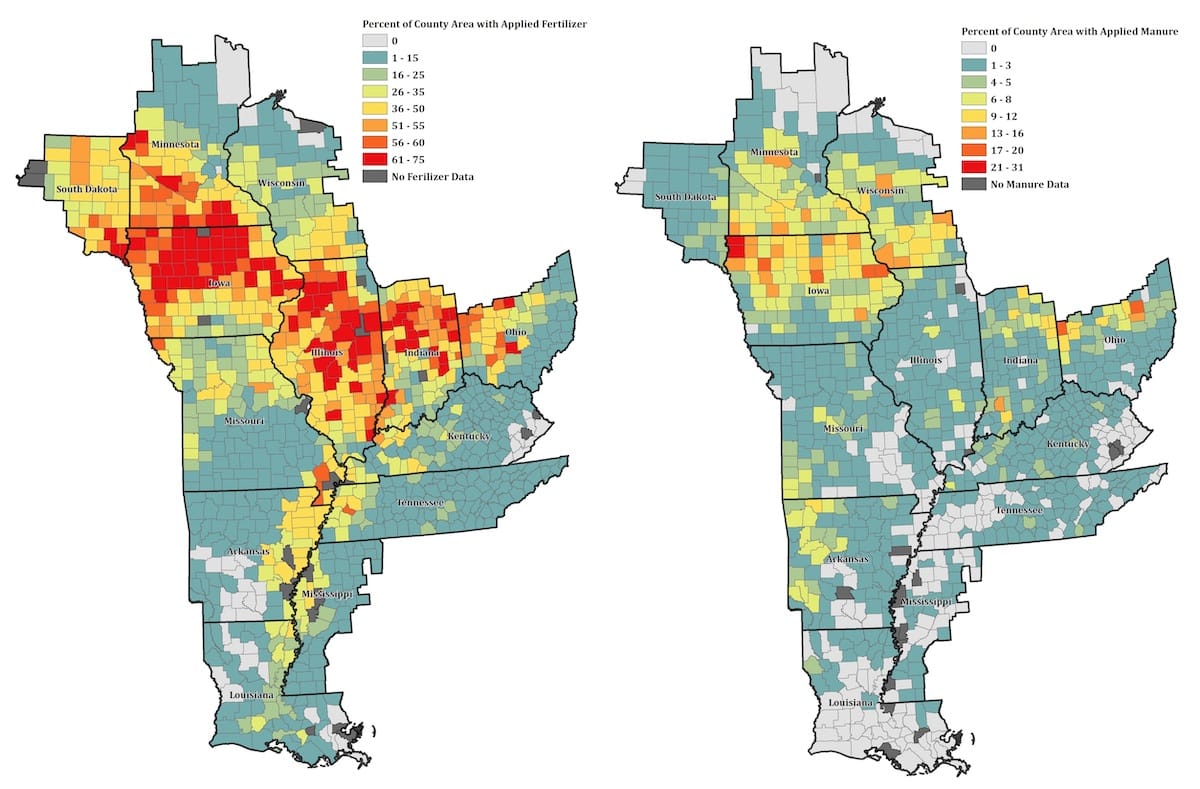
Figure 1. County-level fertilizer and manure application in the MRCCA
Sensitive Landscapes
EWG identified four land types with a higher risk of nutrient loss that are susceptible to climatic events, based on the following characteristics:
- 1. Areas subject to erosion from wind and water
- 2. Zones with a propensity to flooding
- 3. Hydric soil types, indicative of wetlands
- 4. Land adjacent to major rivers and streams
We identified the following spatial data as the best standardized proxies for sensitive landscapes, intersected with cropland areas from the USDA’s Cropland Data Layer to determine the amount of cultivated land in each sensitive area (Figure 2).
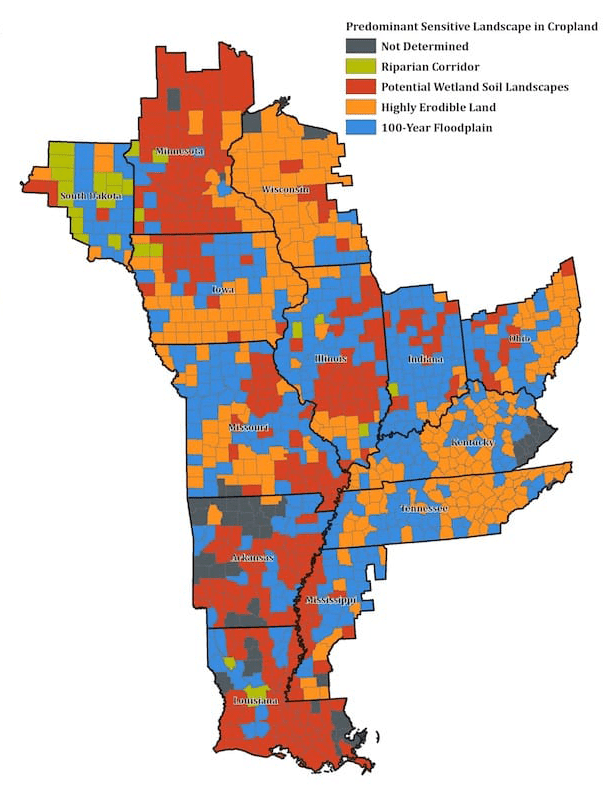
Figure 2. Distribution of sensitive landscapes in the MRCCA
- Highly erodible land
More than 23.9 million acres, or 17 percent of all cropland in the MRCCA, are on fields designated by the USDA as highly erodible land, or HEL. These are fields where at least a third, or 50 acres, of a field have soil properties susceptible to wind and water erosion and are eight times higher than the soil loss tolerance (T) level.3 These fields are subject to Farm Bill conservation compliance provisions requiring producers to maintain some basic conservation systems to remain eligible for some USDA payments.4
Iowa has the most cropland prone to wind and water erosion, with more than 8.3 million acres on HEL. Illinois, Missouri and Wisconsin also had totals above the mean, and the four states account for 71percent of all HEL planted to a commodity. Crawford County in Iowa had the most HEL acres in cropland, with more than 306,000 acres, or 83 percent of all cropland, in the county.
- 100-year floodplain
To administer federal flood insurance, the Federal Emergency Management Agency, or FEMA, has delineated boundaries for areas with a 1 percent chance of flooding annually – also known as the 100-year floodplain.5 Many of these low-lying areas throughout the basin are covered with crops, making them susceptible to flooding. At the time EWG completed this project, the data for 100-year floodplains were not available for 181 of the 1,047 counties within the MRCCA.
In counties where data were available, more than a quarter, or 28 percent, of the 100-year floodplain area was in crop production. Arkansas and Missouri had more than 1.7 million acres of cropland within the floodplain, followed by Illinois, Indiana, Iowa and Mississippi, with more than one million acres in flood-prone areas accounting for almost 72 percent of all cropland in the floodplain. Washington County, Miss., and Butler County, Mo., had more than 161,000 acres planted directly in the floodplain.
- Potential wetland soil landscapes
Using soil surveys, the USDA’s Natural Resources Conservation Service, or NRCS, classifies unique properties, interpretations and productivity within a field as map units. The potential wetland soil landscape rating is calculated as a percent of the map unit characterized as hydric, poorly drained or flooded.6 In this analysis, we considered units only if the rating was 75 percent or more.7
Hydric areas planted with crops make up more than 33 million acres, or 23 percent, of all cultivated area in the MRCCA. Half of this area comes from three states: Illinois, Iowa and Minnesota, which together contain more than 16 million acres of cropland on hydric areas. Three counties contain more than 300,000 acres of wetlands in cultivation: Iroquois and Livingston counties in Illinois and Renville County, Minn.
- Riparian corridor
EWG used the National Hydrography Dataset, or NHD, area features, which represent the general width of a stream or river as a proxy for shoreline.8 A buffer zone of 300 feet, a width beneficial for erosion control, water quality and animal habitat, was used to define a riparian corridor. EWG then determined the amount of cropland within that corridor.9
Just over 5 percent of the defined riparian corridor was in cropland. Almost 80 percent of cultivated riparian corridors are in seven states, led by Missouri, with more than 89,000 acres. Mississippi County, Ark., had the most acres under cultivation in riparian corridors, with more than 16,000 acres of cropland next to rivers and streams.
Total federal outlays
Since 2014, USDA payments to producers in the MRCCA exceeded $59.7 billion. Between 2015 and 2019, 33 percent of those payments came from ad hoc farm subsidy programs like Disaster Assistance and the Market Facilitation Program, or MFP, followed by crop insurance indemnities, with 27 percent, traditional commodity programs such as Agriculture Risk Coverage, or ARC, and Price Loss Coverage, or PLC, at 26 percent, and payments from conservation programs, with 14 percent (Figure 3). Of the three conservation programs assessed – Environmental Quality Incentives Program, or EQIP; the Conservation Stewardship Program, or CSP; and the Conservation Reserve Program, or CRP – CRP accounts for more than three-quarters of all annual payments. For total payments in Figure 3, ad hoc farm subsidy programs, crop insurance and ARC and PLC are shown by program year, whereas conservation payments were aggregated by fiscal year.
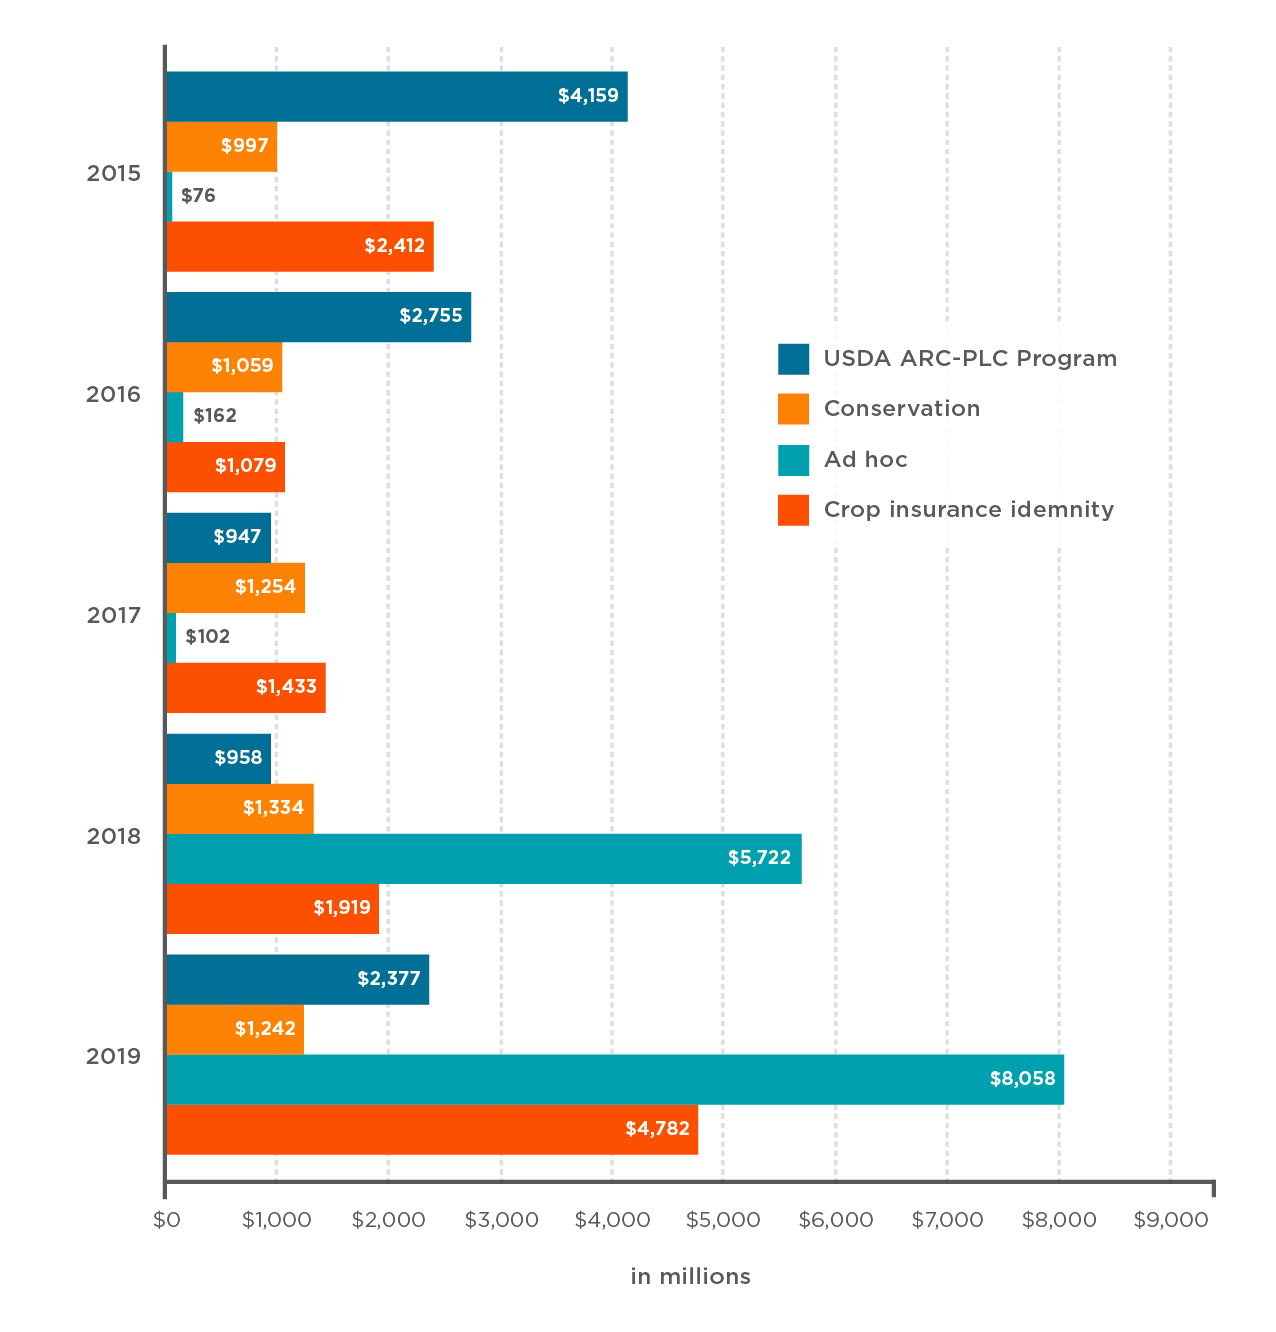
Figure 3. USDA program funding in the MRCCA
Methods and analysis


To establish the cropland footprint, EWG used the 2019 Cropland Data Layer, or CDL, a geospatial product of USDA’s National Agricultural Statistics Service. Cropland was defined as land cover categories 1 to 61 and 204 to 254. This excludes all grassland and pasture. All layers included in the analysis were resampled to match the CDL’s native 30-meter resolution. Once EWG created the cropland universe, fields of fewer than 5 acres were not considered for subsequent analysis.
Data about areas of highly erodible land, or HEL, cropland were derived from USDA’s Farm Service Agency Common Land Unit polygons, using column “HELTYPECD” attributed as “yes.” All features were converted to raster at 30-meter resolution. Areas of HEL overlapping with cropland at 30-meter resolution were considered only if a contiguous area was greater than 5 acres. Percent county area was calculated as cropped area of HEL divided by total cropland within the county.
Potential wetland soil landscapes, or PWSL, cropped areas were taken from the USDA’s Natural Resources Conservation Service SSURGO map units joined to table Valu1, and subset for all “pwsl1pomu” ratings greater than or equal to 75 and less than or equal to 100. All features were converted to raster at 30-meter resolution. Areas of PWSL overlapping with cropland at 30-meter resolution were considered only if a contiguous area was greater than 5 acres. Percent county area was calculated as cropped area of PWSL divided by total cropland within the county.
The 100-year floodplain in crop production was derived from FEMA’s National Flood Hazard Layer, or NFLH, using the “S_FLD_HAZ_AR” feature, where “FLD_ZONE” = “A | AE | A1-30 | AH | AO.” All features were converted to raster at 30-meter resolution. Areas of NFLH overlapping with cropland at 30-meter resolution were considered only if a contiguous area was greater than 5 acres. Percent county area was calculated as cropped area of 100-year flood plain divided by total floodplain in a county.
Cropland in the riparian corridor universe was established using USGS’ National Hydrography Dataset, or NHD, to define shorelines of major rivers and streams using the “Hydrography – NHD Area” feature. A 300-foot buffer was then created on each side of the river or stream. All features were converted to raster at 30-meter resolution. Areas of NHD overlapping with cropland at 30-meter resolution were considered only if a contiguous area was greater than 5 acres. Percent county area was calculated as cropped area of 300-foot riparian corridor divided by total riparian corridor area within the county.
The 2017 USDA Census of Agriculture was used to collect county-level statistics for producer count, operation count, harvested acres of cropland and acres treated for manure and fertilizer. Percent manure and fertilizer is defined as acres treated, divided by harvested acres.
Total USDA payments* represent the county-level sum of all payments made to producers in that county through ad hoc payments from disaster assistance; the Coronavirus Food Assistance Program and the Market Facilitation Program, between 2014 to 2020; all Agriculture Risk Coverage, or ARC, and Price Loss Coverage, or PLC, payments between 2014 to 2019; all crop insurance indemnities from 2014 to 2020; and conservation payments from the Environmental Quality Incentives Program, the Conservation Stewardship Program and the Conservation Reserve Program for 2015 to 2019. Payments for the ad hoc programs, ARC and PLC, and crop insurance are by program year (the year the subsidized crop was harvested), and payments for the conservation programs are by fiscal year.
* Note that payments are missing from the conservation programs in 2014 and 2020, and AR and PLC payments for 2020 will not be made until fall 2021, so those could not be included.
References
- 1 https://www.nrcs.usda.gov/wps/portal/nrcs/detail/ms/technical/cp/?cid=stelprdb1254053
- 2 https://data.nal.usda.gov/dataset/nrcs-regional-conservation-partnership-program-mississippi-river-basin
- 3 https://law.justia.com/cfr/title07/7-1.1.1.1.14.2.html
- 4 https://www.fsa.usda.gov/programs-and-services/payment-eligibility/conservation_compliance/index
- 5 https://www.fema.gov/glossary/flood-zones
- 6 https://www.nrcs.usda.gov/wps/portal/nrcs/detail/soils/survey/?cid=nrcs142p2_053627#:~:text=The%20SSURGO%20database%20contains%20information,the%20course%20of%20a%20century.&text=The%20map%20units%20describe%20soils,properties%2C%20interpretations%2C%20and%20productivity
- 7 https://www.nrcs.usda.gov/Internet/FSE_DOCUMENTS/nrcs142p2_052167.pdf
- 8 https://www.usgs.gov/core-science-systems/ngp/national-hydrography/national-hydrography-dataset?qt-science_support_page_related_con=0#qt-science_support_page_related_con
- 9 http://eightmileriver.org/appendicies/09c3_Riparian%20Buffer%20Science_YALE.pdf